← Everything · Sweden in data
 A project by John Tibell
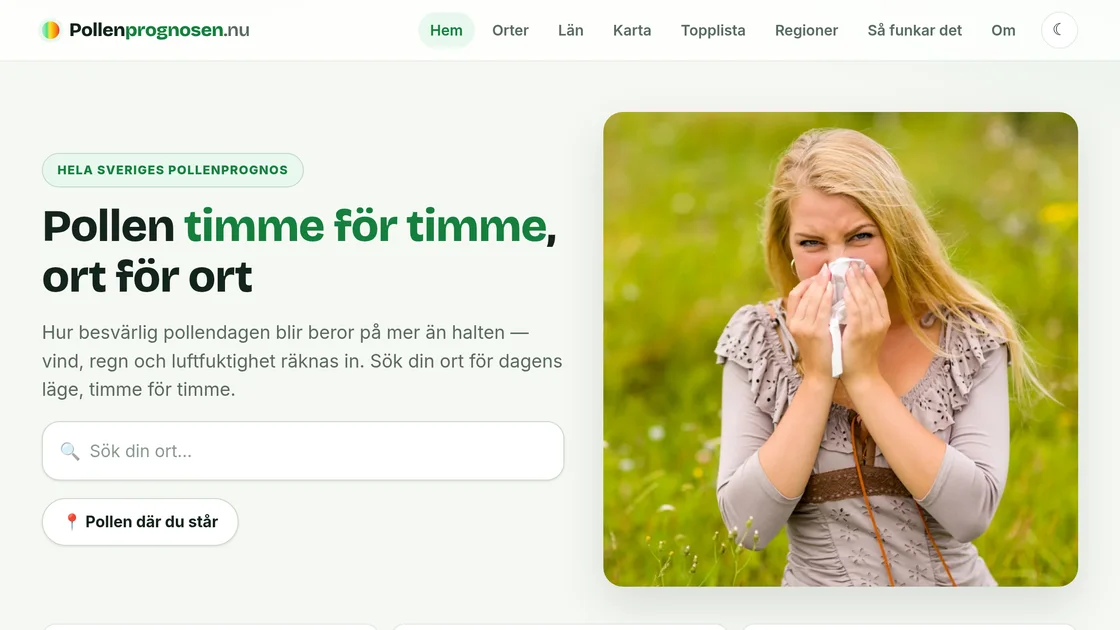
A project by John TibellPollenprognosenPollen, hour by hour, town by town.
How hard the day gets depends on more than the pollen count. So Pollenprognosen shows two things for every town in Sweden: how much pollen is in the air, and how much it's likely to bother you, with wind, rain and humidity counted in.
5kinds of pollen
2layers: count and trouble
24 hhour by hour
● ○measured or calculated
Try it
The same count, a different day
A pollen trap counts grains. It doesn't measure how much they bother you. The weather changes that.
CountThe same
Trouble
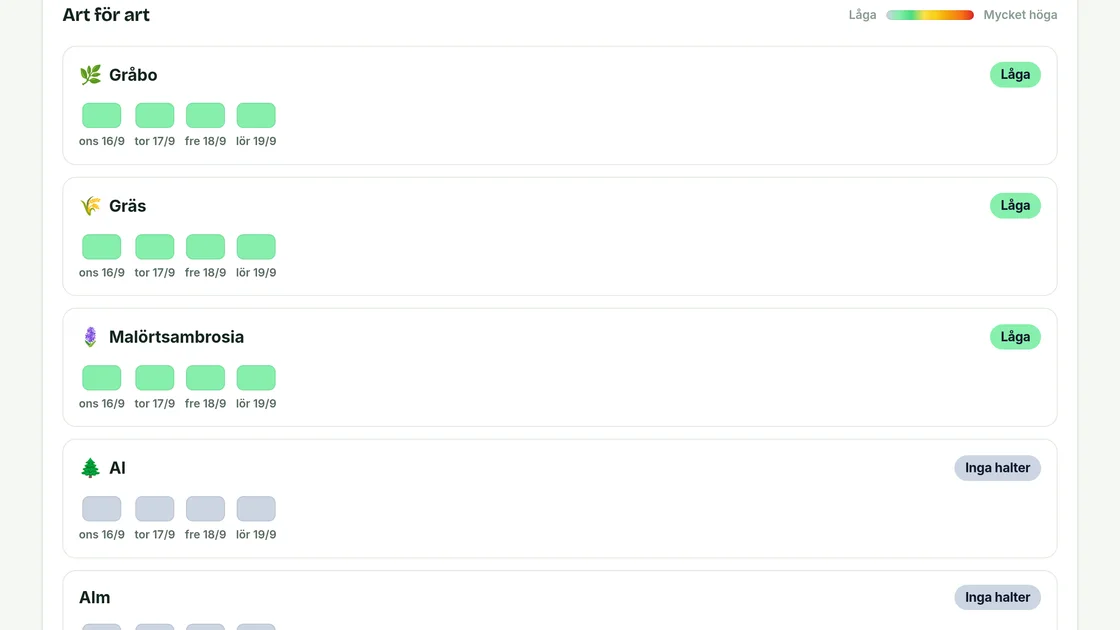
Five kinds
The pollen year
From alder in February to ragweed in October.
FebMarAprMayJunJulAugSepOct
Alder
Feb–Apr
Birch
Apr–May
Grass
May–Aug
Mugwort
Jul–Sep
Ragweed
Aug–Oct
Closer than the region
Down to your town
- Your surroundings countFields, meadows and leafy forest near your town adjust the level up or down. There's less grass pollen in a town centre than in the land around it.
- Pollen where you standUse your position for the level at your exact spot.
- Calmer nearbyHigher ground has less pollen, and later. Wind off a big water carries little. The site points you towards both.
- The map and the top listWatch the pollen cloud move hour by hour, kind by kind, and see where it's worst right now.
“We mark clearly what is measured and what is calculated.”
The trouble layer is marked as experimental. It shows a direction, not an exact measure. It is not medical advice, and it doesn't predict one person's symptoms.
More about Sweden, right now